Only Guatemala Surpasses It: Electricity Prices in Chile Are the Second Highest in Latin America
November 4, 2025
It ranks just behind countries such as Spain and the United Kingdom
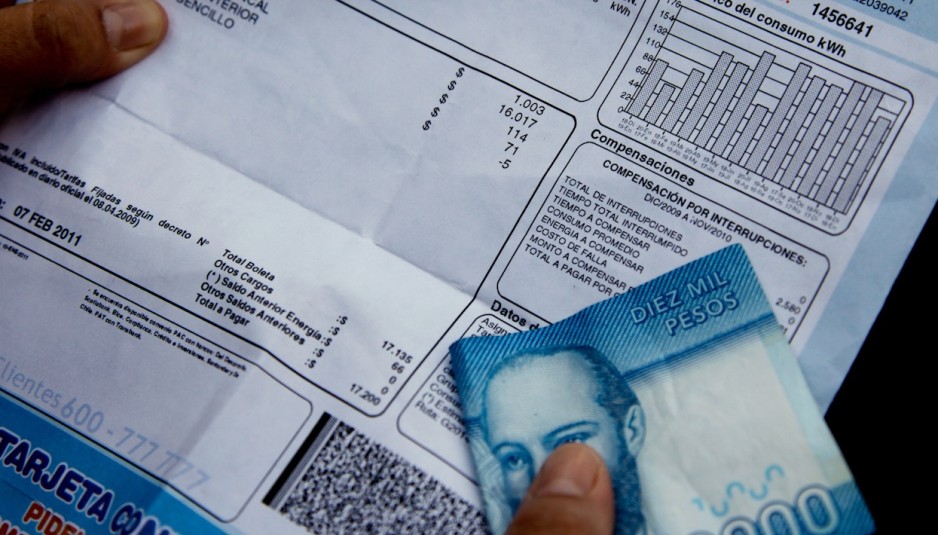
The price of electricity in Chile is the second highest in Latin America and is above the world average. According to Global Petrol Prices, as of March of this year, the cost per kWh in Chile was $262.5 for residential customers. Thus, for the usual household consumption (250 kWh per month), the electricity bill amounts to $65,625. In Latin America, it is only surpassed by Guatemala ($69,725).
Chile’s bill is higher than that of developed countries such as Australia ($60,950), the U.S. ($45,425), Norway ($38,775), and Canada ($28,475). It also exceeds other countries in the region, such as Uruguay ($61,825), Peru ($49,350), Brazil ($38,200), and Argentina ($19,000). The U.S. electricity bill is the closest to the world average.
However, there are still several countries that pay more per kWh of electricity than Chile. The highest value in the world is found in Bermuda, where a household bill reaches up to $113,950. Chile is also surpassed by countries such as Denmark ($111,950), the United Kingdom ($98,900), and Spain ($69,800).
The United States is the country closest to the world average in electricity prices.
The Comparison
Global Petrol Prices collects and processes information from electricity companies and produces a national average that takes into account market share and population size. It also considers factors such as whether the market is regulated, how prices and contracts are determined, and whether there are taxes or charges not reported in contracts but paid by consumers in practice. In Latin America, data is unavailable only for Bolivia and Venezuela.
In Chile’s case, which has a regulated electricity market, the information comes from the National Energy Commission (CNE), Chilquinta, Saesa, CGE, and Enel Distribución. The CNE also prepares a tariff comparison for Latin America, but this information is not currently available on its website. The CNE explains that, due to the ongoing technical review of the Average Node Price (PNP), no tariff comparator will be issued. The commission is currently preparing the final technical report for setting electricity tariffs for the first half of 2026, aiming to correct a methodological error that applied the inflation effect twice. Since Global Petrol Prices’ data corresponds to March 2025, Chile’s tariff includes the CNE’s error.
Electricity Prices Around the World
Electricity rates for households, March 2025
| Country | Price per kWh | Cost for 250 kWh consumption |
|---|---|---|
| Iran | $3.5 | $875 (lowest worldwide) |
| Paraguay | $54.0 | $13,500 |
| China | $71.0 | $17,750 |
| Argentina | $76.0 | $19,000 |
| Ecuador | $92.0 | $23,000 |
| Mexico | $104.5 | $26,125 |
| Canada | $113.9 | $28,475 |
| Brazil | $152.8 | $38,200 |
| Norway | $155.1 | $38,775 |
| Panama | $165.7 | $41,425 |
| Nicaragua | $168.2 | $42,050 |
| Costa Rica | $174.0 | $43,500 |
| United States | $181.7 | $45,425 |
| Peru | $197.4 | $49,350 |
| Colombia | $216.3 | $54,075 |
| Australia | $243.8 | $60,950 |
| Uruguay | $247.3 | $61,825 |
| Chile | $262.5 | $65,625 |
| Guatemala | $278.9 | $69,725 |
| Spain | $279.2 | $69,800 |
| United Kingdom | $395.6 | $98,900 |
| Denmark | $447.8 | $111,950 |
| Bermuda | $455.8 | $113,950 |
Source: Global Petrol Prices — El Mercurio
World average: 177.4 $/kWh
The Differences
The differences between countries can be explained by the size of their markets, the composition of their energy matrix, and the presence of subsidies.
According to Global Petrol Prices, countries with the highest electricity tariffs fall into two main categories. On the one hand, there are remote islands such as Bermuda that depend on fossil fuels for power generation and have no option to import. On the other hand, there are developed countries—mainly in Europe—where high prices are due to taxes and high transmission and distribution costs.
Daniel Salazar, managing partner at EnergiE and former executive director of the National Electrical Coordinator, explains that variations in tariffs among countries are due to differences in size, energy mix, and subsidies. “Size reflects how attractive a country is for investment. In a developed country with a large-scale market that attracts major investments, efficiency improves, and economies of scale are achieved,” he notes.
Salazar adds that Central American countries, which depend heavily on fossil fuels, tend to have higher prices. “There are countries where generation costs are low. For example, in the United States, fuel costs are reduced thanks to natural gas, while in Scandinavian markets, production costs are low due to access to low-cost hydroelectric power, even though taxes are high,” adds Shahriyar Nasirov, researcher at the Center for Energy Transition (Centra), School of Engineering and Sciences, Universidad Adolfo Ibáñez.
In Argentina, the low prices are explained by existing subsidies. Chile also has subsidies, but they are more targeted. In Chile’s case, Salazar points out that one major distortion is the payment of debt accumulated during the years when tariffs were frozen. “If we hadn’t frozen the tariffs, we wouldn’t have a charge that today represents just over 10%. It’s a distorting effect,” he states. “Historically, Uruguay has been the most expensive country in the region, and if it’s not above Chile now, I believe it’s because of this 10–11% debt charge,” he adds.
Nasirov emphasizes that in Chile, “historically, generation costs have accounted for the largest portion of the final electricity price. However, in recent years, with the growing share of solar and wind energy—and more recently, battery storage—systemic costs, which include payments to thermal plants operating at minimum technical levels, stabilization payments to PGMDs, complementary services, transmission, and capacity costs, have become a significant component of the total price.”

